


Commercial International Bank
COMICommercial International Bank - Egypt (CIB) S.A.E.
Company Overview & Activities
مساعدة التنمية الصناعية والتنمية الاقتصادية بصفه عامة في جمهورية مصر العربية، وتحقيقا لهذا الغرض سيتم تسجيله كبنك تجاري ويخضع لكافة القوانين المطبقة علي البنوك التجارية وخاصة قانون البنك المركزي والجهاز المصرفي رقم 194 لسنة 2020والضوابط والتعليمات الرقابية والقرارات الصادرة من البنك المركزي المصري، وللبنك الحق في ممارسة كافة العمليات المصرفية والمالية داخل جمهورية مصر العربية وخارجها وبصفه خاصة اعمال الاعتمادات المستندية وقبول الكمبيالات والنقد الاجنبي وغير ذلك من العمليات الخاصة بتسهيل التجارة، وله ايضا ان يقدم تسهيلات التمويل قصيرة وطويلة الاجل للشركات الاجنبية والمحلية، وان يتعامل في كل من سوق النقد وسوق رأس المال و ان يشجع بصفه عامة الاستثمارات الاجنبية في جمهورية مصر العربية. ودون الحد من اوجه النشاط السابقة فسوف يكون النشاط الغالب للبنك موجها للعمليات الخارجية الخاصة بتسهيل التبادل التجاري بين جمهورية مصر العربية والدول الاجنبية، بالإضافة الي تمويل خدمة الاستثمارات اللازمة لمتطلبات التنمية ودعم الاقتصاد القومي. وللبنك في حدود القوانين السارية في جمهورية مصر العربية ممارسة كافة ا
EGS60121C018
1995-02-02
FRA Certified Auditor
Financial FAQ & Technical Outlook for Commercial International Bank - Egypt (CIB) S.A.E. (COMI)
Quantitative Technical Engine (COMI)
Commercial International Bank holds a Bullish technical posture (Overall Score: 64.2/100) with Trend Score 45/100, Momentum Score 100/100 (RSI 55.44 - Bullish Momentum), and Volume Score 70/100 (accumulating, 0.92x 20D baseline).
Support & Resistance Confluence Matrix
AlgorithmicNearest support is at 127.17 [Strength: 58.9/100, Tier 3 (Intraday 1-min)] (1.28% below price with a 75.6% confirmed bounce rate across 41 tests, Reliability: High). Nearest resistance is at 128.92 [Strength: 49.4/100, Tier 3 (Intraday 1-min)] (0.08% above price with a 37.5% confirmed rejection rate across 8 tests, Reliability: Moderate).
Seasonal Trend & Historical Patterns (COMI)
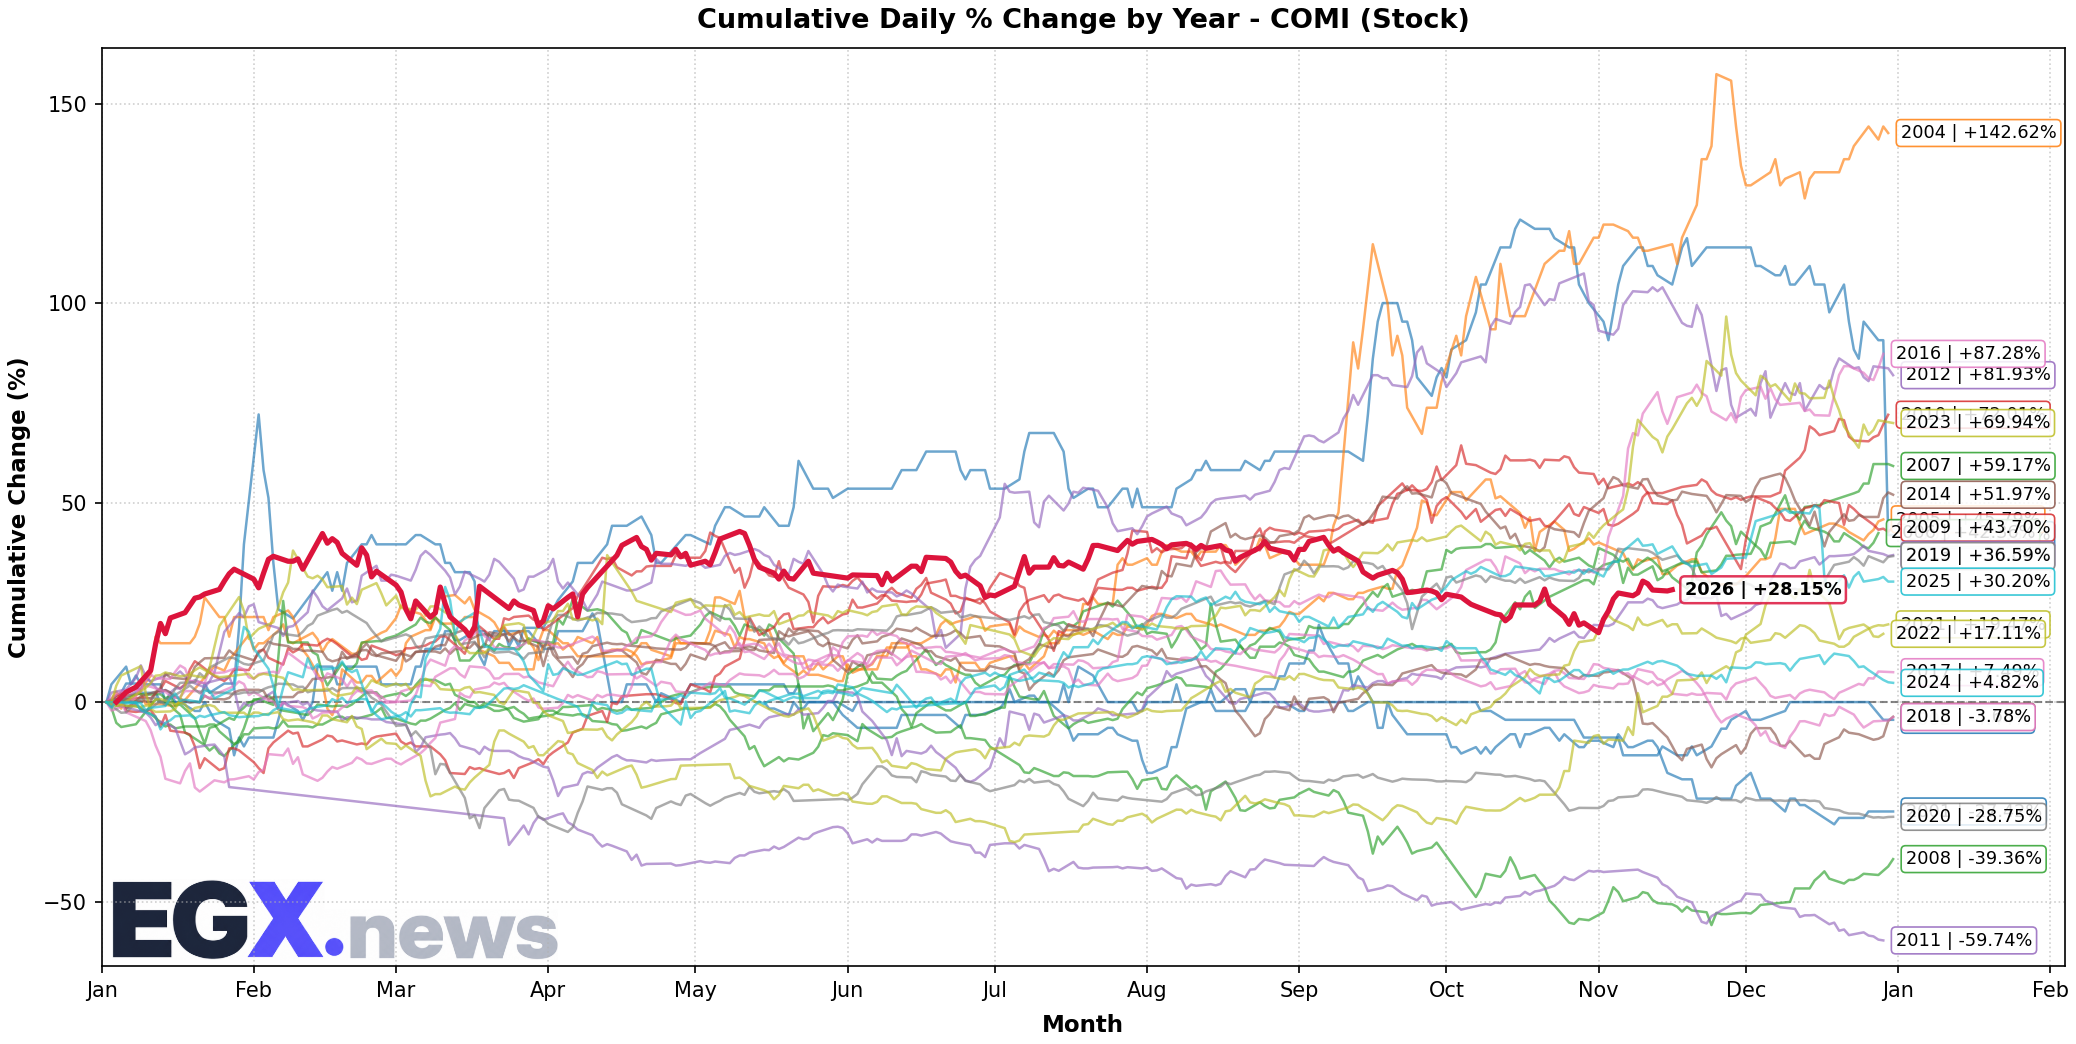
Click to EnlargeHistorical monthly seasonal return distribution and performance cycles for COMI.
Trend Structure & Moving Averages
Trend Score is 45/100 with price trading 2.83% above its 20-day SMA and below the 200-day long-term benchmark (SMA50 is below SMA200).
Momentum, Volume Flow & Volatility
RSI(14) is 55.44 (Bullish Momentum), moving -0.37 over the past 5 sessions — indicating positive momentum in buyer territory. MACD line (0.733) is above signal line (-0.151) with a histogram of +0.884 (Bullish Momentum).
20-day annualized volatility is 29.4%, ATR(14) is 2.44 (1.89% of price), and price is trading in the middle channel (%B: 0.725, Bandwidth: 12.59%).
Statistical Backtests & Historical Win Rates
BacktestedEmpirical backtesting reveals that RSI oversold dips (<30) historically yield an average 20-day return of +3.32% with a 66.0% win rate (100 observations, Reliability: High), while volume spikes yield an average 20-day return of +2.51% (54.77% win rate).
Price sits 11.16% below All-Time High (145.01 set 175 sessions ago on 2026-02-16) and 11.16% below its 52-week high (145.01 on 2026-02-16).